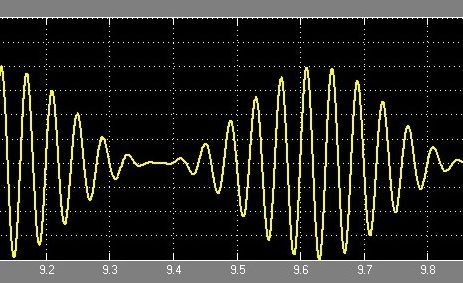
AM Generation using Simulink
Amplitude modulation (AM) is a one of the conventional technique used to transmit message signals using a carrier wave. The amplitude or strength of the high frequency carrier wave is modified in accordance with amplitude of the message signal. If you are a newbie to Simulink, please read our article Introduction to Simulink. First of all lets get into the basics.. Carrier signal (Sc) = Acsin(2πfct) Message signal (Sm) = Amsin(2πfmt) # fm must be smaller than fc When...
AM Generation using Matlab
Amplitude modulation (AM) is a one of the conventional modulation technique to transmit signals using a carrier wave. The amplitude or the strength of a high frequency carrier wave is changed in accordance with the amplitude of message signal. Generation of AM in MATLAB is a piece of cake. If you are new to MATLAB, please go through our tutorials. First of all lets get into the basics.. Carrier signal (Sc) = Acsin(2πfct) Message signal (Sm) = Amsin(2πfmt) Where, Ac - Amplitude of the carrier signal Am...
Introduction to Simulink in MATLAB
Simulink (Simulation and link) is developed by MathWorks as an add-on with MATLAB. It is a graphical programming language which offers modelling, simulation and analyzing of multi domain dynamic systems under Graphical User Interface (GUI) environment. The Simulink have tight integration with the MATLAB environment and have a comprehensive block libraries and toolboxes for linear and nonlinear analyses. The system models can be so easily constructed via just click and drag operations. The Simulink comes handy while dealing with control theory...
Signal Operations in MATLAB
Here I'm going to discuss about basic signal operations that can be done in MATLAB. Visit our tutorial guide on MATLAB to get familar with the basic concepts. This tutorial includes : Addition Subtraction Multiplication Shifting a Signal Reversing a Signal Linear Convolution of 2 signals
Addition
Addition can be carried out using the ' + ' symbol and plotting will give you the result. Eg : x=[1 2 3 4]; subplot(3,1,1); stem(x); title('X'); y=[1 1 1 1]; subplot(3,1,2); stem(y); title('Y'); z=x+y; subplot(3,1,3); stem(z); title('Z=X+Y'); OUTPUT : Plot of Signal Addition With Same time Index NOTE: In the above example index value...Signal Generation in MATLAB
Here I’m going to show you how signals can be generated in MATLAB. If you are a newbie in this field, have a look at our MATLAB tutorials to get familiar with it.
Plotting of Discrete and Continuous signal
The 2 main functions for plotting are plot() function - For plotting Continuous signal stem() function - For plotting Discrete signal stem() - 2-D plot function for plotting discrete sequence of data SYNTAX : stem(y) - Plots the data sequence y specified equally spaced...Introduction to 2D Plotting in MATLAB
MATLAB not only helps us for calculation but also helps us in data analysis and visualization by plotting graphs and waveforms. It provides us with a 'big picture' of our data. Here I'm going to discuss about the 2D plotting in MATLAB. If you haven't yet started with MATLAB please goto our Matlab Tutorials.
Plotting
Using fplot()
fplot() : It is used to plot between the specified limits. The function must be of the form y=f(x), where x is a vector whose specifies the...Introduction to MATLAB – Beginners Tutorial
MATLAB (Matrix Laboratory) is a forth generation high level programming language and interactive environment for numerical computation developed by MathWorks. It allows data analysis and visualisation, matrix manipulations, function plotting, developing algorithms, creating models and applications, interfacing programs written in other languages such as C, C++, Java and FORTRAN. Applications of MATLAB includes Communication Systems, Embedded Systems, Computational Biology, Digital Signal Processing, Computational Finance, Control Systems, Mechatronics, FPGA Design and Co-design, Test and Measurement, Image and Video Processing and Technical Computing.