
Signal Operations in MATLAB
Contents
Here I’m going to discuss about basic signal operations that can be done in MATLAB. Visit our tutorial guide on MATLAB to get familar with the basic concepts.
This tutorial includes :
- Addition
- Subtraction
- Multiplication
- Shifting a Signal
- Reversing a Signal
- Linear Convolution of 2 signals
Addition
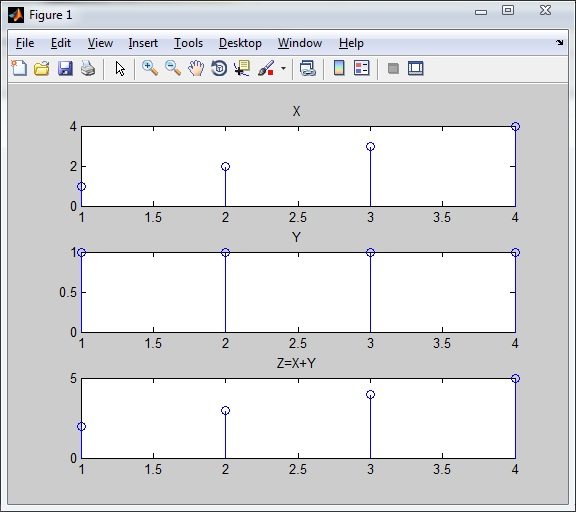
Addition can be carried out using the ‘ + ‘ symbol and plotting will give you the result.
Eg :
x=[1 2 3 4];
subplot(3,1,1);
stem(x);
title('X');
y=[1 1 1 1];
subplot(3,1,2);
stem(y);
title('Y');
z=x+y;
subplot(3,1,3);
stem(z);
title('Z=X+Y');
OUTPUT :
NOTE:
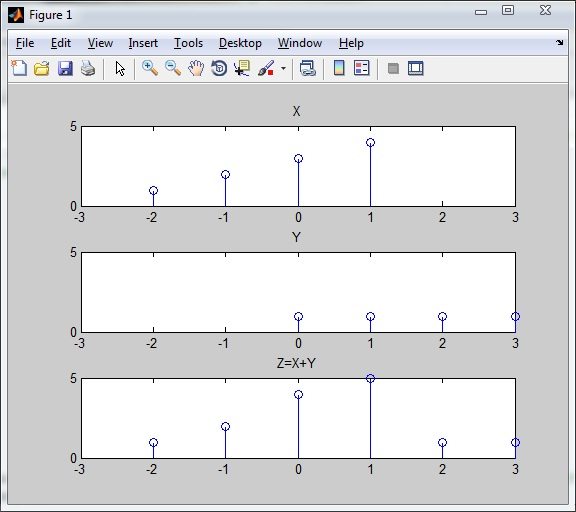
- In the above example index value of both the signals x and y are the same. If the index values are different we have to find the range of output by comparing the index values of both signals.
Step 1 : After the 2 signals are defined find the duration of output signal using min & max functions
Step 2: Initialize the signals with the duration found, else mismatch in length of the input signals error will be shown
- Generating a zero matrix of 1 row having elements with length = duration of output
- Making the length of input signals equal by making duration of both equal to that of output
- For making the duration of input signal equivalent to that of output we have to generate two signals s1,s2
- s1 and s2 are generated as a zero matrix using the zeros function having a length, equivalent to the duration found using min and max function earlier in Step 1
- Now the next step is filling in the input elements of x and y in appropriate position of s1 and s2. For it we have to find the indices corresponding to fill out.The logical statement is as follows. Here the elements satisfying the condition will be assigned 1
(( n3>=min( n1 ) ) & ( n3 <=max ( n1 ) )==1
- An array of 1 is created in the respective position which satisfies the condition eg: [ 1 1 1 ] and the other position will be having a zero value as the s is zero matrix defined by us so that the altogether result will be an array of 1’s and 0’s eg: [ 1 1 1 0 0]
and using find function we can find the index values of the position which are 1 now and assigning the variables of input signal there,
Say for eg :
x=[1 2 3] and s1=[0 0 0 0 0]
We need s(1 2 3) =x ; ie we have to fill the first 3 position of s1 as x elements. similarly with the 2nd signal. In the above condition we are making the elements of s1 equal to 1 .where the elements of x has to be filled in so the output will be an array like this s1= [ 1 1 1 0 0]. Now using find () function calculating the indices of the position whose elements are equal to 1.
so that the s(1 2 3)= x ; now the elements of x will be filled in the respective position of s1.Same with the other signal
The complete statement is
s1 (find ( ( n3>=min( n1 ) ) & ( n3 <=max ( n1 ) )==1 ) )=x;
 % signal x with the duration of  output signal
s2 (find ( ( n3>=min ( n2 ) ) & ( n3 <=max ( n2 ))==1) )=y;
% signal y with the duration of  output signal
Eg:
n1=-2:1;
x=[1 2 3 4];
subplot(3,1,1);
stem(n1,x);
title('X') ;
axis([-3 3 0 5]);
n2=0:3;
y=[1 1 1 1];
subplot(3,1,2);
stem(n2,y);
title('Y');
axis([-3 3 0 5]);
n3 =min (min(n1) ,min( n2 ) ) : max ( max ( n1 ) , max ( n2 ) );  %  finding the duration of output signal
s1 =zeros(1,length (n3) );
s2 =s1;
s1 (find ( ( n3>=min( n1 ) ) & ( n3 <=max ( n1 ) )==1 ) )=x;
% signal x with the duration of  output signal add
s2 (find ( ( n3>=min ( n2 ) ) & ( n3 <=max ( n2 ))==1) )=y;
 % signal y with the duration of  output signal add
add=s1 +s2; % addition
subplot(3,1,3)
stem(n3,add)
title('Z=X+Y');
axis([-3 3 0 5]);
OUTPUT:
Functions Used :
1. min() and max() : used to find minimum and maximum value.
Syntax:
- min()
- min(x) -returns smallest element in an array if x is an array.
-returns a row vector containing minimum element from each column if x is a matrix - min(x,y)- returns an array with the same size of x and y.Elements of corresponding indices are checked and minimum value is
returned.x and y must be of same length.
- max()
- max(x) -returns largest element in an array if x is an array.
-returns a row vector containing maximum element from each column if x is a matrix - max(x,y)
-returns an array with the same size of x and y.Elements of corresponding indices are checked and maximum value is
returned.x and y must be of same length.
2. zeros() : returns a zero matrix
Synatx:
- zeros( n ) – returns a n x n matrix of zeros.
- zeros(m,n) – returns a m x n matrix of zeros.
- zeros(m,n,p,…) – returns a m x n x p … array f zeros
3. find() : returns the indices of non zero elements.
Syntax:
- find(x) – returns the liner indices of non zero elements in an array x
eg : if x= [ 0 4 0 5 6]
find(x);
output : 2 4 5 - find(x,n)- returns atmost first n indices of non zero element in an array
A relational operator can also be implemented in find().
For eg : find( x>10) – wil return the indices of element which are greater than 10
4. axis() : used to change the attributes of the axes
Syntax:
- axis([xmin xmax ymin ymax])- set the limits for x and y axes
5.stem(): Used for discrete time ploting of signals
For more help in ploting and other functions in MATLAB visit our tutorials.
Subtraction
With the same program code as of addition replacing arithmetic operator ‘ – ‘ we can perform subtraction in signals.
n1=-2:1;
x=[1 2 3 4];
subplot(3,1,1);
stem(n1,x);
title('X') ;
axis([-4 4 -5 5]);
n2=0:3;
y=[1 1 1 1];
subplot(3,1,2);
stem(n2,y);
title('Y');
axis([-4 4 -5 5]);
n3 =min (min(n1) ,min( n2 ) ) : max ( max ( n1 ) , max ( n2 ) ); % finding the duration of output signal
s1 =zeros(1,length (n3) );
s2 =s1;
s1 (find ( ( n3>=min( n1 ) ) & ( n3 <=max ( n1 ) )==1 ) )=x;
% signal x with the duration of output signal 'sub'
s2 (find ( ( n3>=min ( n2 ) ) & ( n3 <=max ( n2 ))==1) )=y;
% signal y with the duration of output signal 'sub'
sub=s1 - s2; % subtraction
subplot(3,1,3)
stem(n3,sub)
title('Z=X-Y');
axis([-4 4 -5 5]);
OUTPUT :
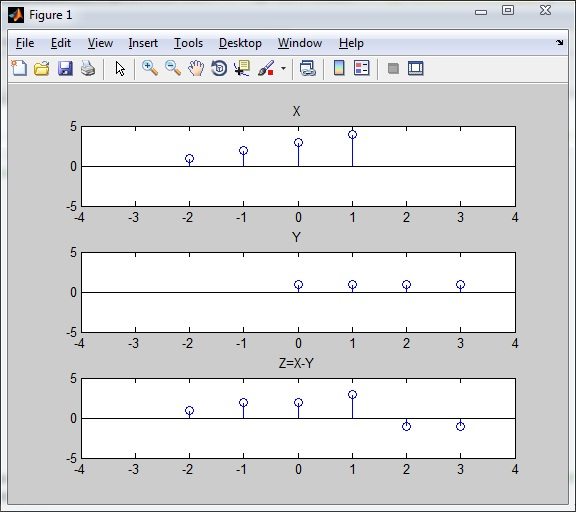
NOTE :
- Ensure that axis is specified correctly to show the negative values too.
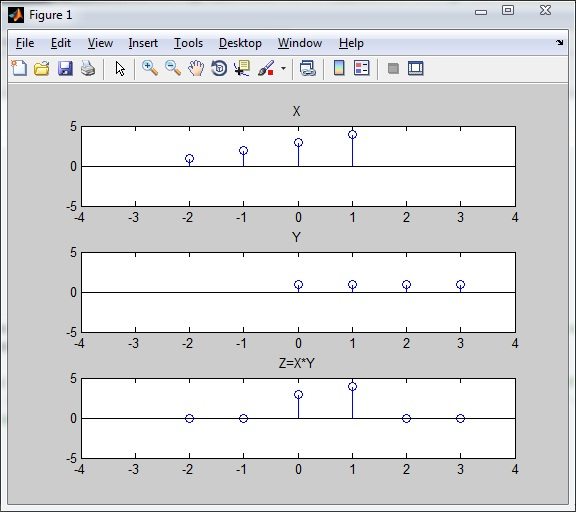
Multiplication
By using ‘ * ‘ ( asterisk) operator we can perform multiplication of signals.
Eg:
n1=-2:1;
x=[1 2 3 4];
subplot(3,1,1);
stem(n1,x);
title('X') ;
axis([-4 4 -5 5]);
n2=0:3;
y=[1 1 1 1];
subplot(3,1,2);
stem(n2,y);
title('Y');
axis([-4 4 -5 5]);
n3 =min (min(n1) ,min( n2 ) ) : max ( max ( n1 ) , max ( n2 ) ); % finding the duration of output signal (out)
s1 =zeros(1,length (n3) );
s2 =s1;
s1 (find ( ( n3>=min( n1 ) ) & ( n3 <=max ( n1 ) )==1 ) )=x;
% signal x with the duration of output signal 'mul'
s2 (find ( ( n3>=min ( n2 ) ) & ( n3 <=max ( n2 ))==1) )=y;
% signal y with the duration of output signal 'mul'
mul=s1 .* s2; % multiplication
subplot(3,1,3)
stem(n3,mul)
title('Z=X*Y');
axis([-4 4 -5 5]);
OUTPUT :
Shifting a Signal
MATLAB can be used to perform shifting of signals. A signal can be delayed as well as advanced.
- The basic idea is to add the shift value to indices and thereby plotting the signal.
The following is a program to delay or advance a signal x(n). The shift value is decided at the run time.
Eg:
n1=input('Enter the amount to be delayed');
n2=input('Enter the amount to be advanced');
n=-2:2;
x=[-2 3 0 1 5];
subplot(3,1,1);
stem(n,x);
title('Signal x(n)');
m=n+n1;
y=x;
subplot(3,1,2);
stem(m,y);
title('Delayed signal x(n-n1)');
t=n-n2;
z=x;
subplot(3,1,3);
stem(t,z);
title('Advanced signal x(n+n2)');
OUTPUT :

Delayed by 2
Advanced by 3
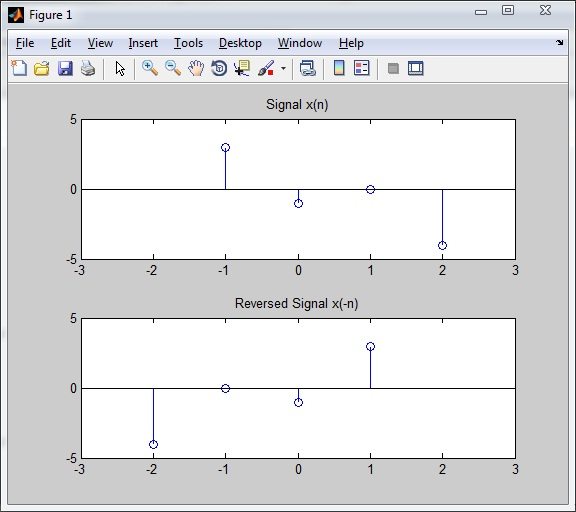
Reversing a Signal
The inbuilt function fliplr() function can be used to perform reversing or folding a signal.
Syntax:
- fliplr(a) : if a is row vector it returns a vector with the same size of a but with reversed order.
if a is column vector it flips the elements one column to the other.
Basic idea :
- flip the elements
- flip the indices with a ‘ – ‘ sign.
Eg:
n=-1:2;
x=[3 -1 0 -4];
subplot(2,1,1)
stem(n,x);
axis([-3 3 -5 5]);
title('Signal x(n)');
c=fliplr(x);
y=fliplr(-n);
subplot(2,1,2);
stem(y,c);
axis([-3 3 -5 5]);
title('Reversed Signal x(-n)') ;
OUTPUT :
Linear Convolution of Signals
Linear convolution between signals can be easily performed in MATLAB using conv() function. I hope you are familiar with the linear convolution of 2 signals.
Syntax:
- conv (a,b)- Convolves the vectors a and b.
Eg:
p=input('Enter the limit for x');
q=input('Enter the limit for y');
x=input('Enter the elements for x');
y=input('Enter the elements for y');
n1=0:p ;
n2=0:q;
subplot(3,1,1);
stem(n1,x);
title('Signal - x(n)');
subplot(3,1,2);
stem(n2,y);
title('Signal - h(n)');
z=conv(x,y);
t=length(n1)+length(n2)-1;
s=0:t-1;
subplot(3,1,3);
stem(s,z);
title('Output - y(n)');
OUTPUT:
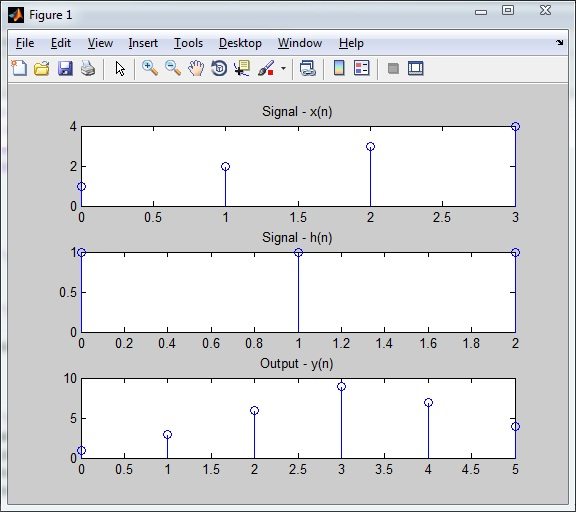
p=3 ; q=2
NOTE :
- Since we have defined the indices to start from 0 we have to enter ‘ n+1 ‘ values in array if the limit is ‘n’.
In the code limit of x & y is p &q respectively so we have to enter p+1 and q+1 values - length() – function is used to calculate the length or size.
SYNTAX:
length(a)- returns the size of the array a.
- ‘ t ‘ variable used in the code is the length of the output. As you may be aware that the total length of convolved output will be l+m-1 ( length of x array + length of y array – 1).
- The output’s indices are also defined. If not specified MATLAB by default starts from 1, h(0) will be treated as h(1) and so on. So to avoid it we have to externally define the range of output’s index values.