
Introduction to 2D Plotting in MATLAB
Contents
MATLAB not only helps us for calculation but also helps us in data analysis and visualization by plotting graphs and waveforms. It provides us with a ‘big picture’ of our data. Here I’m going to discuss about the 2D plotting in MATLAB. If you haven’t yet started with MATLAB please goto our Matlab Tutorials.
Plotting
Using fplot()
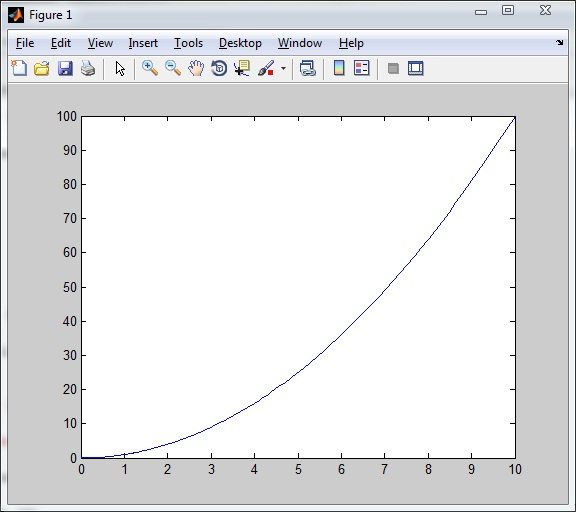
fplot() : It is used to plot between the specified limits. The function must be of the form y=f(x), where x is a vector whose specifies the limits, and y is a vector with the same size as x.
SYNTAX :
- fplot(fun, limits) – A function fun is plotted in between the limits specified
- fplot(fun, limits, linespace) – allows plotting fun with line specification
- fplot(fun, limits, tol) -allows plotting with relative error tolerance ‘tol’.If not specified default tolerance will be 2e-3 ie .2% accuracy.
- fplot(fun, limits, tol, linespace) – allows plotting with relative tolerance and line specification
eg :
fplot( 'x.^2' , [0,10])
Output:
Using plot()
In this case we need to specify the functions for x and y separately .Here we use a function plot () in MATLAB library
plot(): allows 2-D line plotting
SYNTAX:
- plot(y)-plots the columns of y versus the index of each value when y is a real number. For complex y it is equivalent to plot (real (y),img(y))
- plot(x1,y1,……..xN,yN) – plots y versus x
- plot(x1,y1,linespace…..xN,yN,linespace)-plots y versus x along with line specification
eg :
x= linspace(0,10*pi,5); # linspace is not line specification it is used to generate linearly spaced vectors
y=sin (x);
plot(x,y)
Ouput :

NOTE:
- linspace is an inbuilt function which generates equally spaced vectors.
- linspace(a, b) – generates 100 linearly spaced vectors
- linspace(a,b,n) – generates n linearly spaced vectors including a,b
- sin()-Trignometric sine function
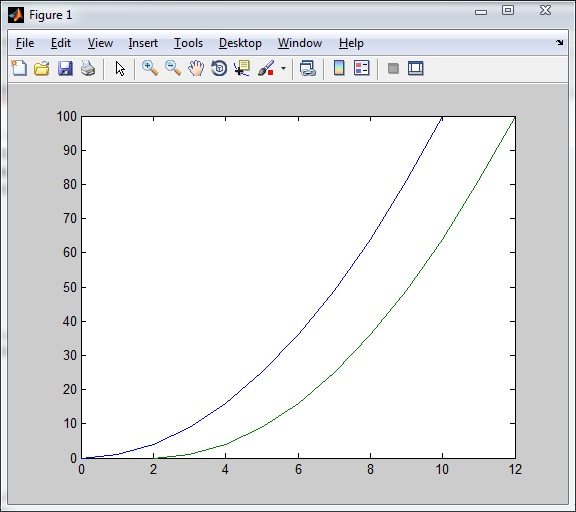
# For plotting 2 functions at a time
Syntax :poly(x1,y1,x2,y2)
eg:
x=0:10;
y=x.^2;
z=2:12;
t=x.^2;
plot(x,y,z,t)
Output :
NOTE:
- To change the characteristics of the plot we can use plottools function. A box will pop up showing your output, we can change change the characteristics there like color, plot type. We can also more data to the plot.
Shortcut method for quick editing:
This might be handy for the people who are always get bored dealing with the menu box in plottools. For quick and simple editing we don’t have to deal with plottools. We can have a third argument in the plot function.
Syntax: plot ( x, y,’color or line style or data points’)
eg : plot (x, y,’r*–‘) # A red dotted plot is obtained.
- Available colors are red, blue, magenta, black, white, green, yellow, cyan
- Data points can be marked
- Linestyle can be changed.
- Regular line- ‘ – ‘
- Dotted lines- ‘ : ‘
- Dashed line- ‘ – – ‘
NOTE:
Colorspec is a method of specifying colors. There are 3 ways with which you can specify color
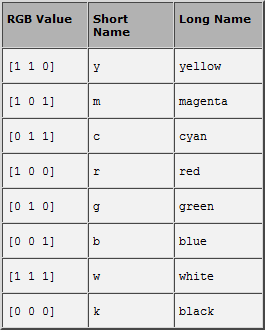
eg :
x=1:5;
y=1:5;
z=x+y;
plot(z,'r*--')
Output:

Some useful info:
- axis equal function allows us to make the axes equal
- line() function allows us to join the line after data points are plotted.
Eg:
x=1:5;
y=1: 5;
z=x+y;
plot(z,'r*--')
axis equal
Output:
Histogram and Pie Chart
MATLAB also helps us to plot Histogram and Pie chart.
Histogram
hist() function helps us to plot the histogram .
SYNTAX:
- n=hist(y) – Bins the elements in vector y into 10 equally spaced containers and returns the number of elements in each container as a row vector.
- n=hist(y,x)- Where x is a vector, returns the distribution of y along length (x) bins with centers specified by x.
- n=hist(y,nbins) – Here nbins is scalar and uses it as number of bins
eg :
x=rand(1000,1); #rand function generates nxn matrix ; rand(m,n) generates mxn square matrix
fix(x);         # used to round it off to 0
hist(x,5)       # returns the distribution of x in 5 length bin;
Output:

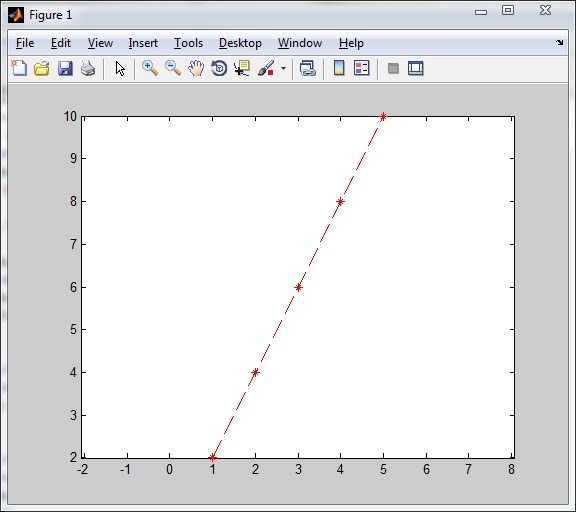
Piechart
pie() function helps us to plot the pie chart of our data.
SYNTAX:
- pie(x)- draws a pie chart with the data in x.
- pie(x,explode)-Offsets a slice from the pie.explode is a vector or matrix of zeroes and non zeroes corresponding to x.
eg:
marks=[10,20,30,40,50]
pie(marks)
Output:
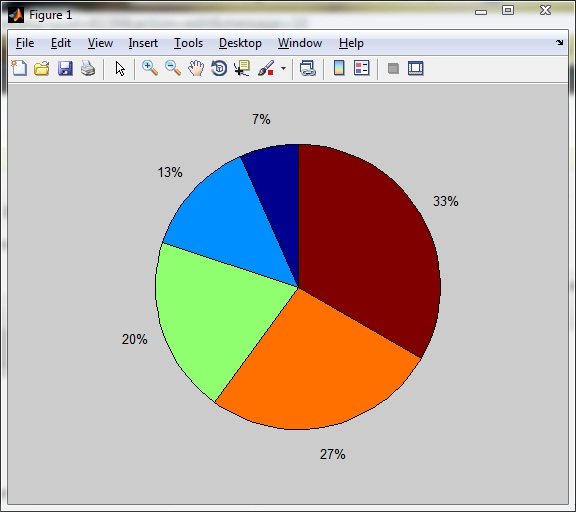
We can plot our data using scatter() function. In this data may be some points in a plane. So instead of using plot function we can directly use scatter function
SYNTAX:
- scatter(x,y)-draws the markers in default size and color
- scatter(x,y,s)-draws markers with specified sizewith single color.
- scatter(….,markertype)-use the marker type instead of ‘0’.
- scatter(…, filled)- Fills the markers.
eg :
x=rand(50,1);
y=rand(50,1);  # make sure that x and y equal length vectors
scatter(x,y)
Output:
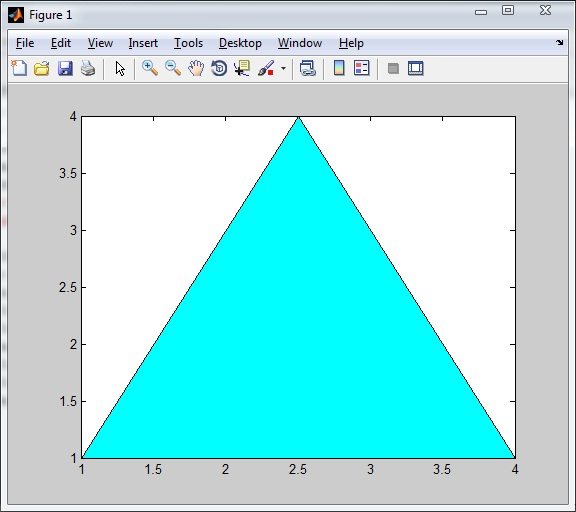
For plotting filled polygons we may use fill() function. The vertices are listed along with the color to be filled.
SYNTAX:
- fill(x,y,)-Creates filled polygons from the data specified by x and y with color c.
- fill(x1,y1,c1….xN,yN,cN)- specifies multiple 2-D filled areas
- fill(x,y,colorspec)- fills 2-D polygons specified by X and Y with the color specified by colorspec explained in earlier section
eg:
x=[1.0,4.0,2.5];
y=[1.0,1.0,4.0];
fill(x,y,'c')
Output:
LABELLING
MATLAB also allows labelling of axes.
- xlabel() function allows to label the x axis.
SYNTAX: xlabel(‘string’)
- ylabel() function allows labelling of y axis
SYNTAX: ylabel(‘string’)
- title()– function allows giving title to our plot
SYNTAX: title(‘string’)
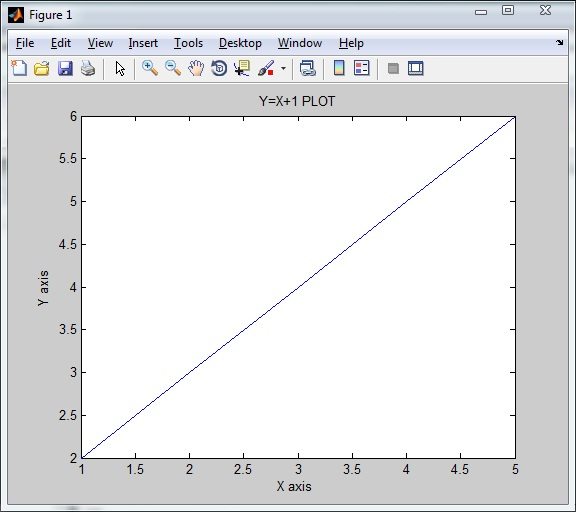
eg:
x=1 : 5;
y=x+1;
plot(x,y)
xlabel('X axis ')
ylabel(' Y axis ')
title('Y=X+1 PLOT')
Output :